
🧰 Project 3D: Potentiometer Bar Graph!
This Project is an Example of…
LCD DISPLAYS
LCD bar graphs are used to show the level of a certain something, such as a progress bar for a battery charger or settings on a sound mixer for a DJ!Required Components
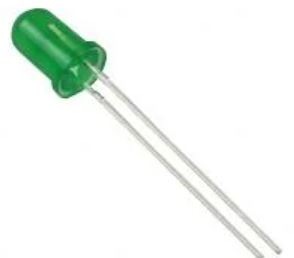


Let's use the potentiometer to control a number of LEDs. We'll read the value of the pot and turn on more LEDs as the value of the pot goes higher.
Since we're putting these LEDs in a row, we call this type of project a "bar graph," and you can use it to display rising values in a number of different projects.
What you will learn:
Unlike Pulse-Width Modulation (PWM), this project uses what can be called a "stair step" approach. When the value of the pot hits predefined intervals, we turn on one more LED.
This is a bit different than PWM, which was varying in a continuous manner. Here, although the values of the pot vary continuously, we chop that input up and we only tell the Arduino to change its output when one of the predefined intervals is met.
Add Sketch to Editor
Download the Sketch
Fritzing Diagram
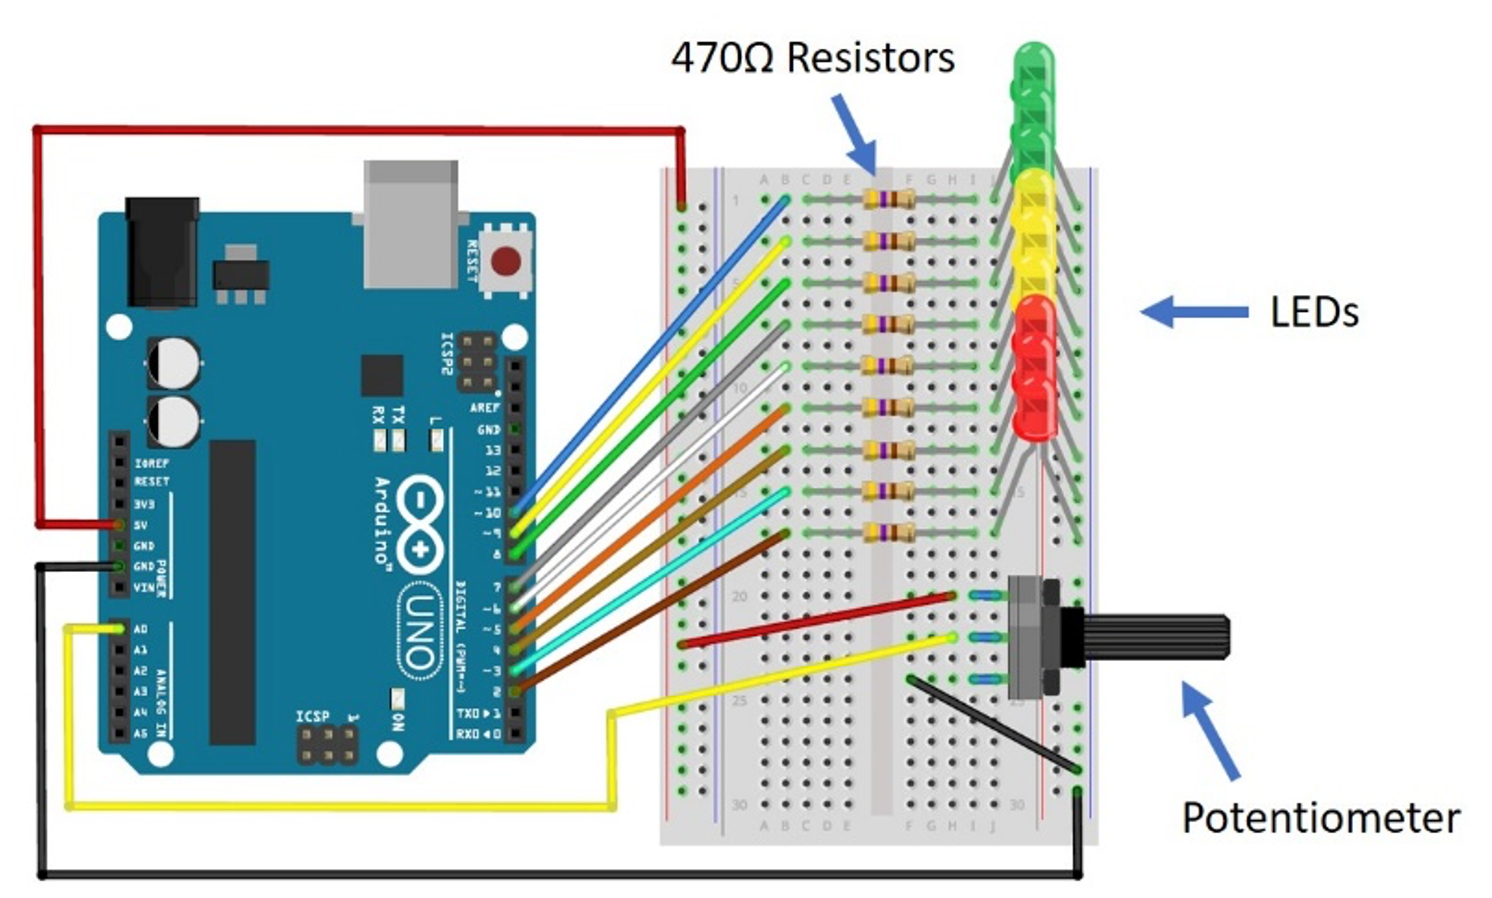
Building Tips
- Wire this project according to the Fritzing diagram for Project 3D.
- This is the most complicated project you have built so far!
- Because there are so many components on the breadboard, and because they are so close together, spacing is critical, so look closely at the Fritzing diagram and follow the layout carefully.
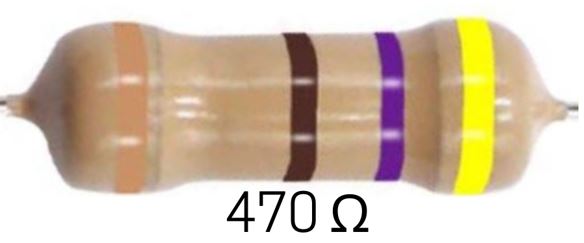
- Leave one or two rows between each resistor/LED combination.
- Start at the top and work your way down, being careful not to disturb the previously built components when putting in new ones.
- Be especially careful with the orientation (placement of the long and short legs) of all those LEDs. If they are backwards, it is more difficult to change later when there are so many installed close together.
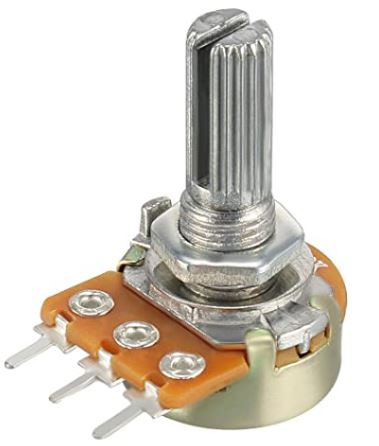
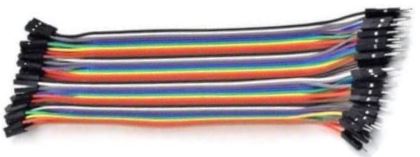
- IMPORTANT: Make sure to plug the long color jumper wire to the CENTER lead of the potentiometer.
- The other end of the color jumper wire goes to Analog Pin A0 on the Arduino.
- Double-check your connections before powering up, especially the power connections.
- UPLOAD AND SAVE the correct/current sketch to your Arduino from the Web Editor.
Expand Your Learning
Experiment with the potentiometer by turning the dial up and down.
- Do all of your LEDs light up?
- Do they all turn off when you turn the pot completely off/left/CCW?
- Do they all turn on when you turn the pot completely on/right/CW?
Think of other things you could use the bar graph technique for. What else could you control a bar graph with, besides a potentiometer?